Airline Passenger Satisfaction Analysis
This is a coursework of Econometrics - Theory and Applications I. The programming language is Python.
———
Introduction
Airline industry is extremely competitive and passenger satisfaction is always top of mind for airline companies. Beside increasing the service quality and the flight safety, passenger satisfaction has a significant influence toward the business. Dissatisfied or disengaged passengers mean fewer return customers, less revenue and degrades the company. It is important that passengers have an excellent experience every time they travel. On-time flights, good in-flight entertainment, more (and better) snacks, and more leg room might be the obvious contributors to a good experience and more loyalty. While we might hear about those aspects the most, the customer experience is not about just the flight itself. Its everything from purchasing the ticket on the company’s website or mobile app to checking bags in at the airport or via a mobile app to waiting in the terminal. Therefore, it is an interesting topic to investigate the relationship between customer’s attitude with some certain factors from satisfaction survey.
This paper is intended to improve our understanding the effective of passenger’s satisfaction toward the airline company with the following question: What are the most important factors affecting passenger’s satisfaction?
I tend to answer this question by mining the relationship between the satisfaction level and the associated attributes using regression with a binary dependent variable such as Probit Regression.
Data and Variable Description
The passenger’s satisfaction for Invistico Airline dataset is from Kaggle (https://www.kaggle.com/sjleshrac/airlines-customer-satisfaction). The dataset contains various features related to an airline passenger satisfaction survey. The dataset contains 129,880 observations, 1 dependent variable (satisfaction) and 22 independent variables.
<class 'pandas.core.frame.DataFrame'>
RangeIndex: 129880 entries, 0 to 129879
Data columns (total 23 columns):
 #   Column                             Non-Null Count   Dtype
---  ------                             --------------   -----
 0   satisfaction                       129880 non-null  object
 1   gender                             129880 non-null  object
 2   customer_type                      129880 non-null  object
 3   age                                129880 non-null  int64
 4   type_of_travel                     129880 non-null  object
 5   class                              129880 non-null  object
 6   flight_distance                    129880 non-null  int64
 7   seat_comfort                       129880 non-null  int64
 8   departure_arrival_time_convenient  129880 non-null  int64
 9   food_and_drink                     129880 non-null  int64
 10  gate_location                      129880 non-null  int64
 11  inflight_wifi_service              129880 non-null  int64
 12  inflight_entertainment             129880 non-null  int64
 13  online_support                     129880 non-null  int64
 14  ease_of_online_booking             129880 non-null  int64
 15  on_board_service                   129880 non-null  int64
 16  leg_room_service                   129880 non-null  int64
 17  baggage_handling                   129880 non-null  int64
 18  checkin_service                    129880 non-null  int64
 19  cleanliness                        129880 non-null  int64
 20  online_boarding                    129880 non-null  int64
 21  departure_delay_in_minutes         129880 non-null  int64
 22  arrival_delay_in_minutes           129487 non-null  float64
dtypes: float64(1), int64(17), object(5)
memory usage: 22.8+ MB
The Factor features: satisfaction, gender, customer type, type of travel, and class.
The Integer features: age, flight distance, seat comfort, departure/arrival time convenient, food and drink, gate location, inflight wifi service, inflight entertainment, online support, ease of online booking, on board service, leg room service, baggage handling, check-in service, cleanliness, online boarding, departure delay in minutes, and arrival delay in minutes.
The following 14 columns are ratings showing in number from 0 (least satisfied) to 5 (most satisfied): seat comfort, departure/arrival time convenient, food and drink, gate location, inflight wifi service, inflight entertainment, online support, ease of online booking, on board service, leg room service, baggage handling, check-in service, cleanliness, online boarding.
In the dependent variable, about 54.7% of the observations are labeled as “satisfied”, and 45.3% are labeled as “dissatisfied”.
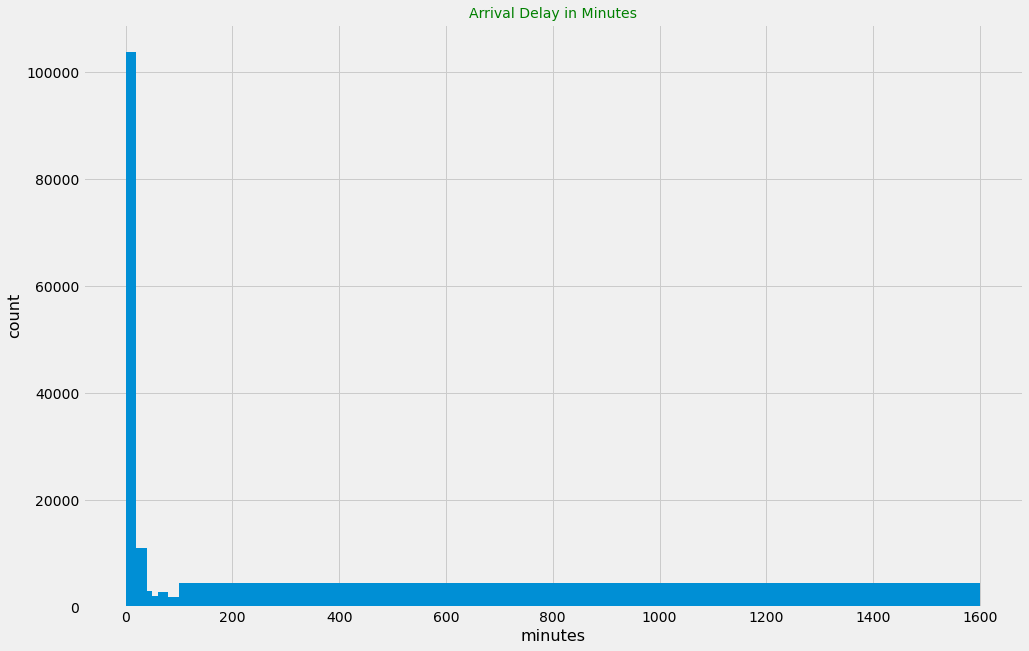
After I checked the dataset, I have found that there are 393 missing values in arrival_delay_in_minutes. Because most of the arrival delay minutes are less than 200 minutes, and there are few arrival delays which have very high minutes. In order not to distort the data by those extreme values, I have decided to replace these missing values with median value of this attribute. See the distribution of counts in different minutes range of arrival delay in minutes in Figure 1.
Figure 1: Count of arrival delay in minutes
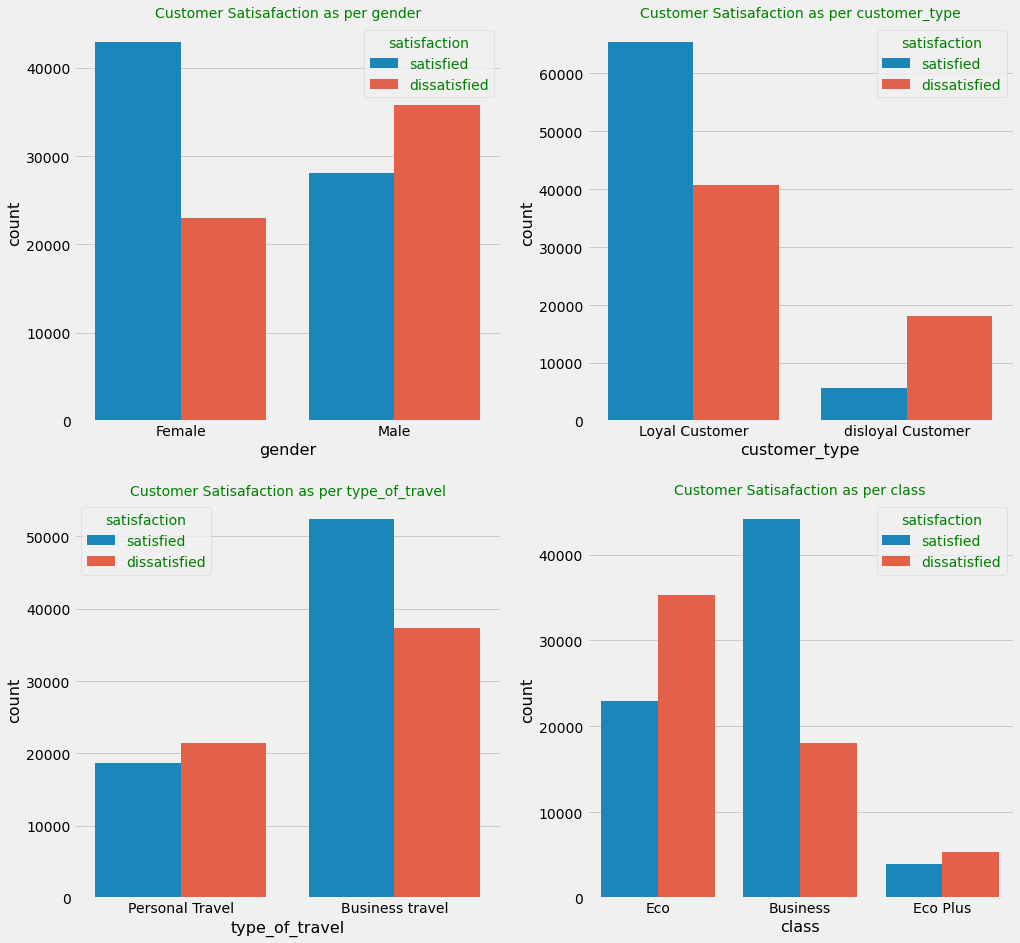
Figure 2: Distribution of customer satisfaction in each categorical attribute
Figure 2 shows that satisfaction is much higher for female passengers, while male passengers tend to be more dissatisfied; higher proportion of loyal customer was satisfied than disloyal customers; higher proportion of customers who were in business travel was satisfied than those in personal travel; higher proportion of customers took business class was satisfied.
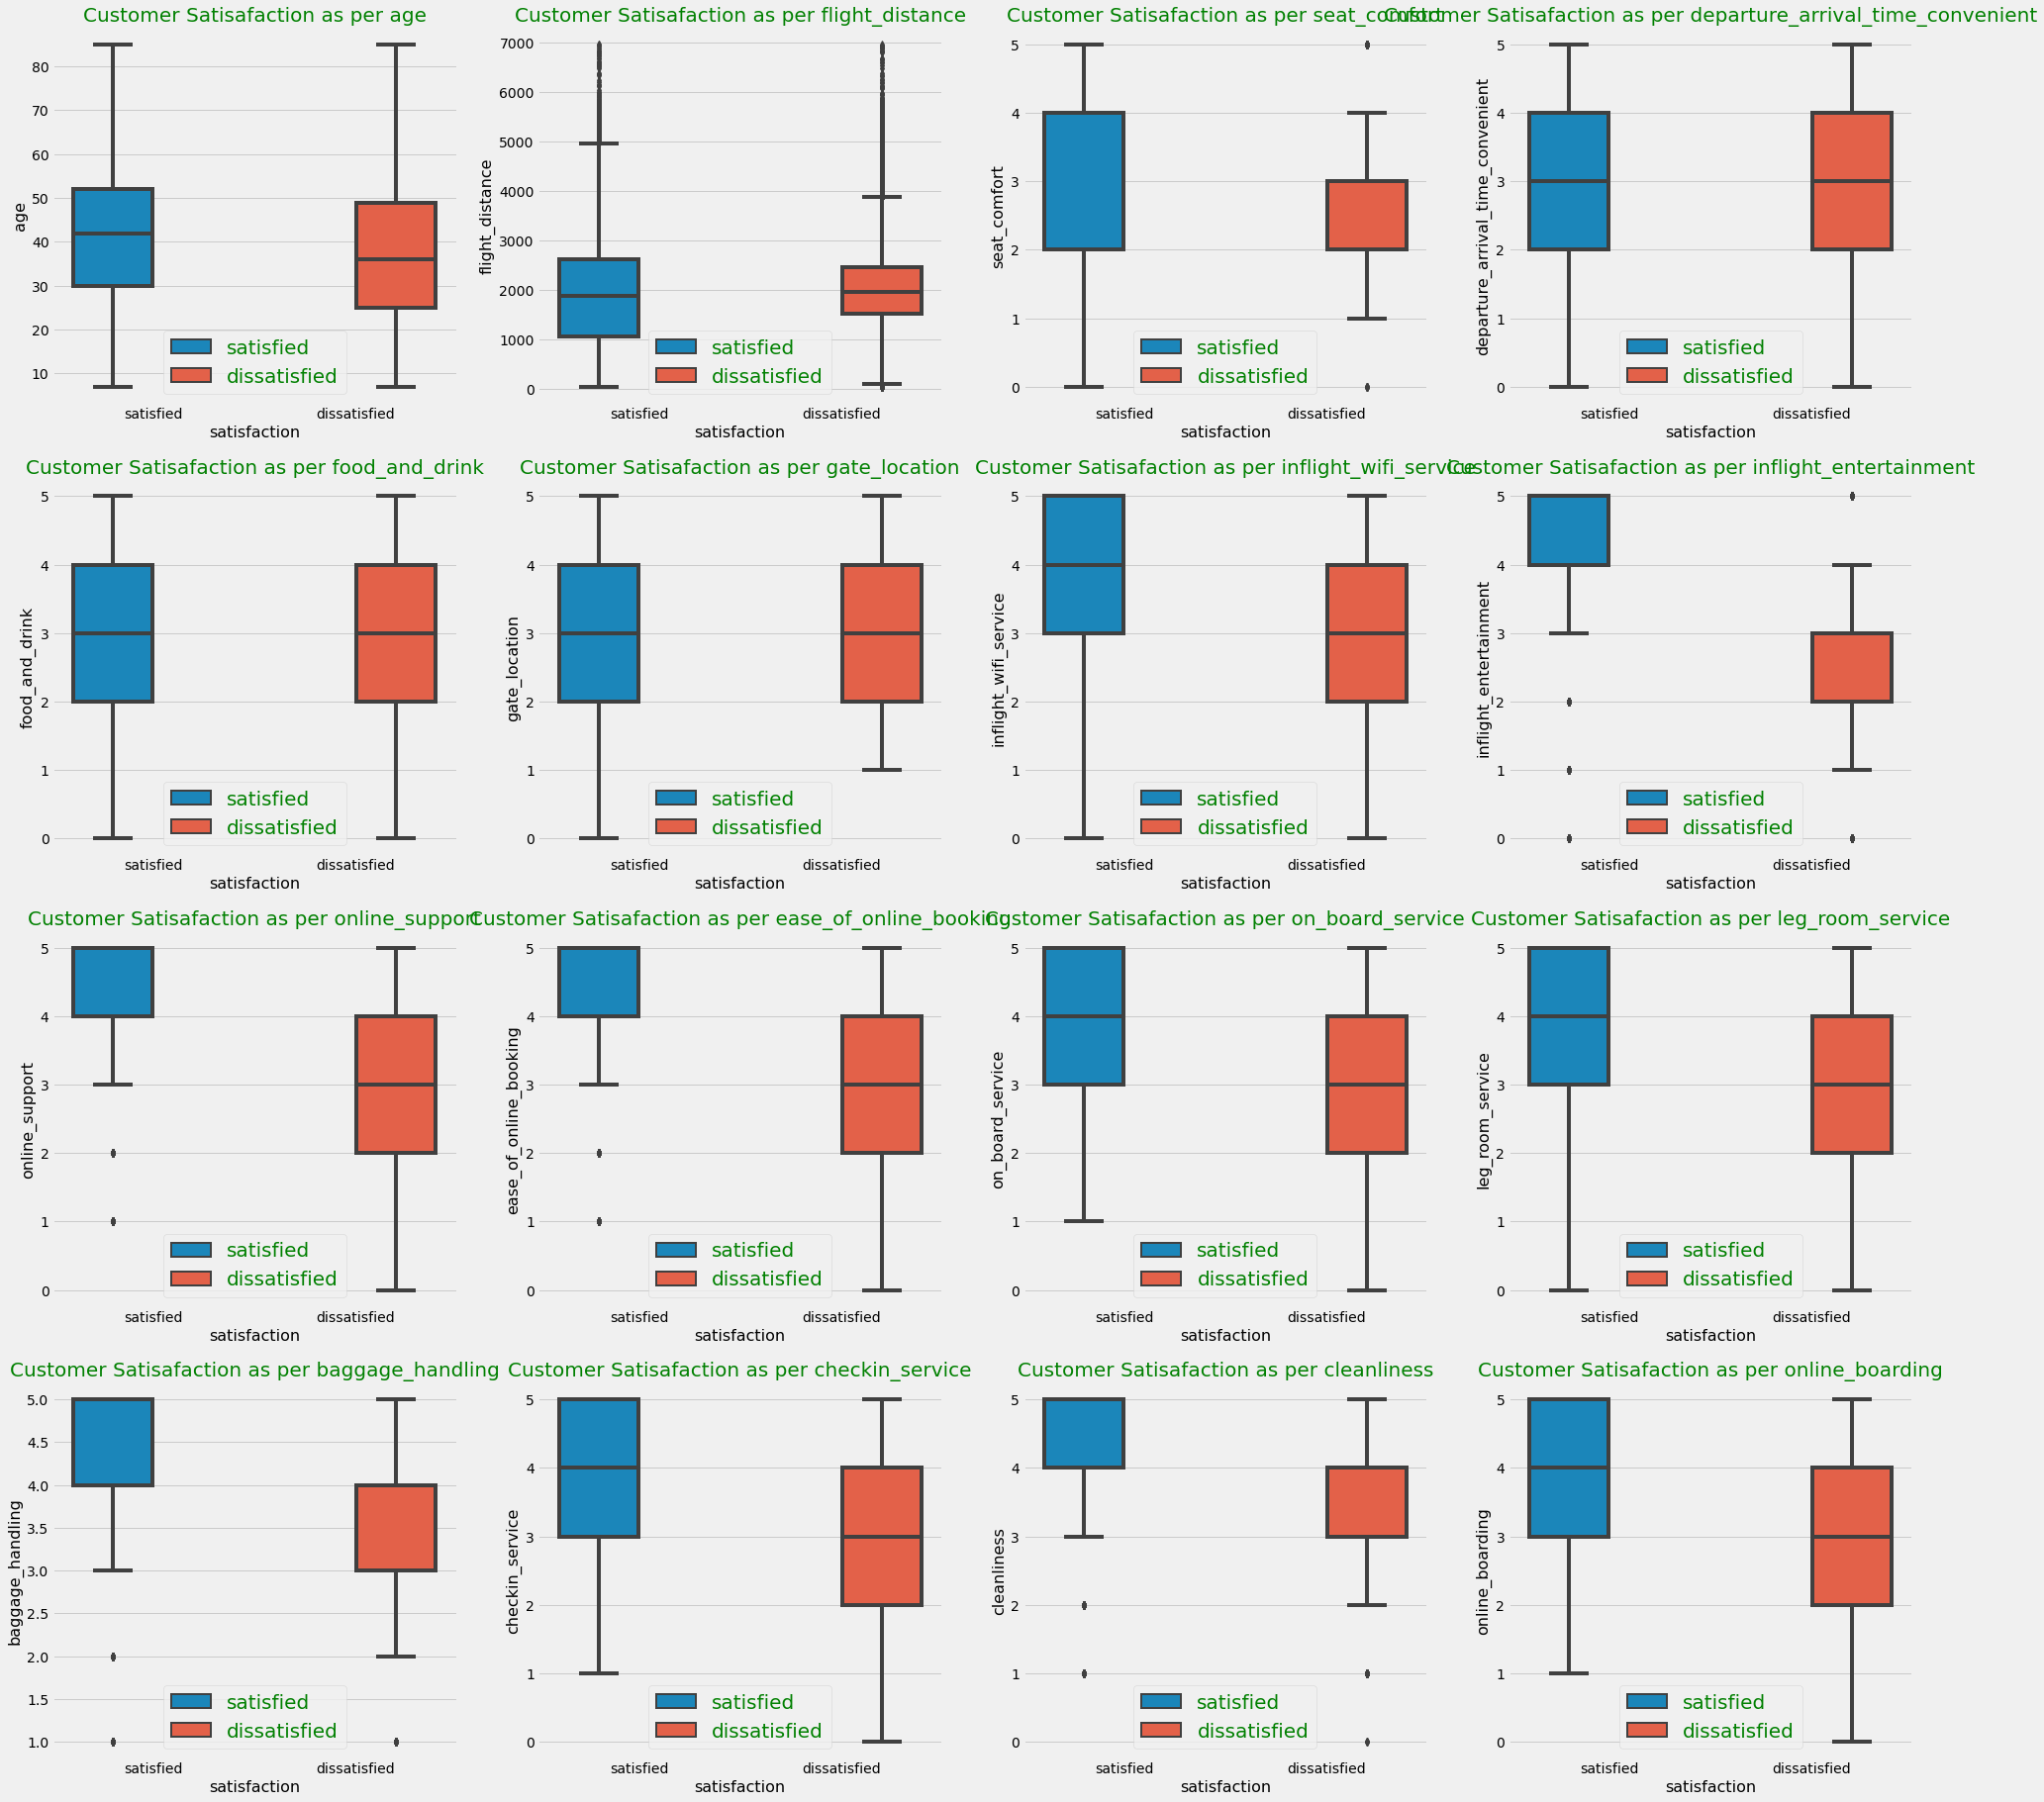
Figure 3: Distribution of customer satisfaction in each numerical attribute
Figure 3 shows that the more satisfied the customer with the service, then there was greater chance that the customer will be satisfied.
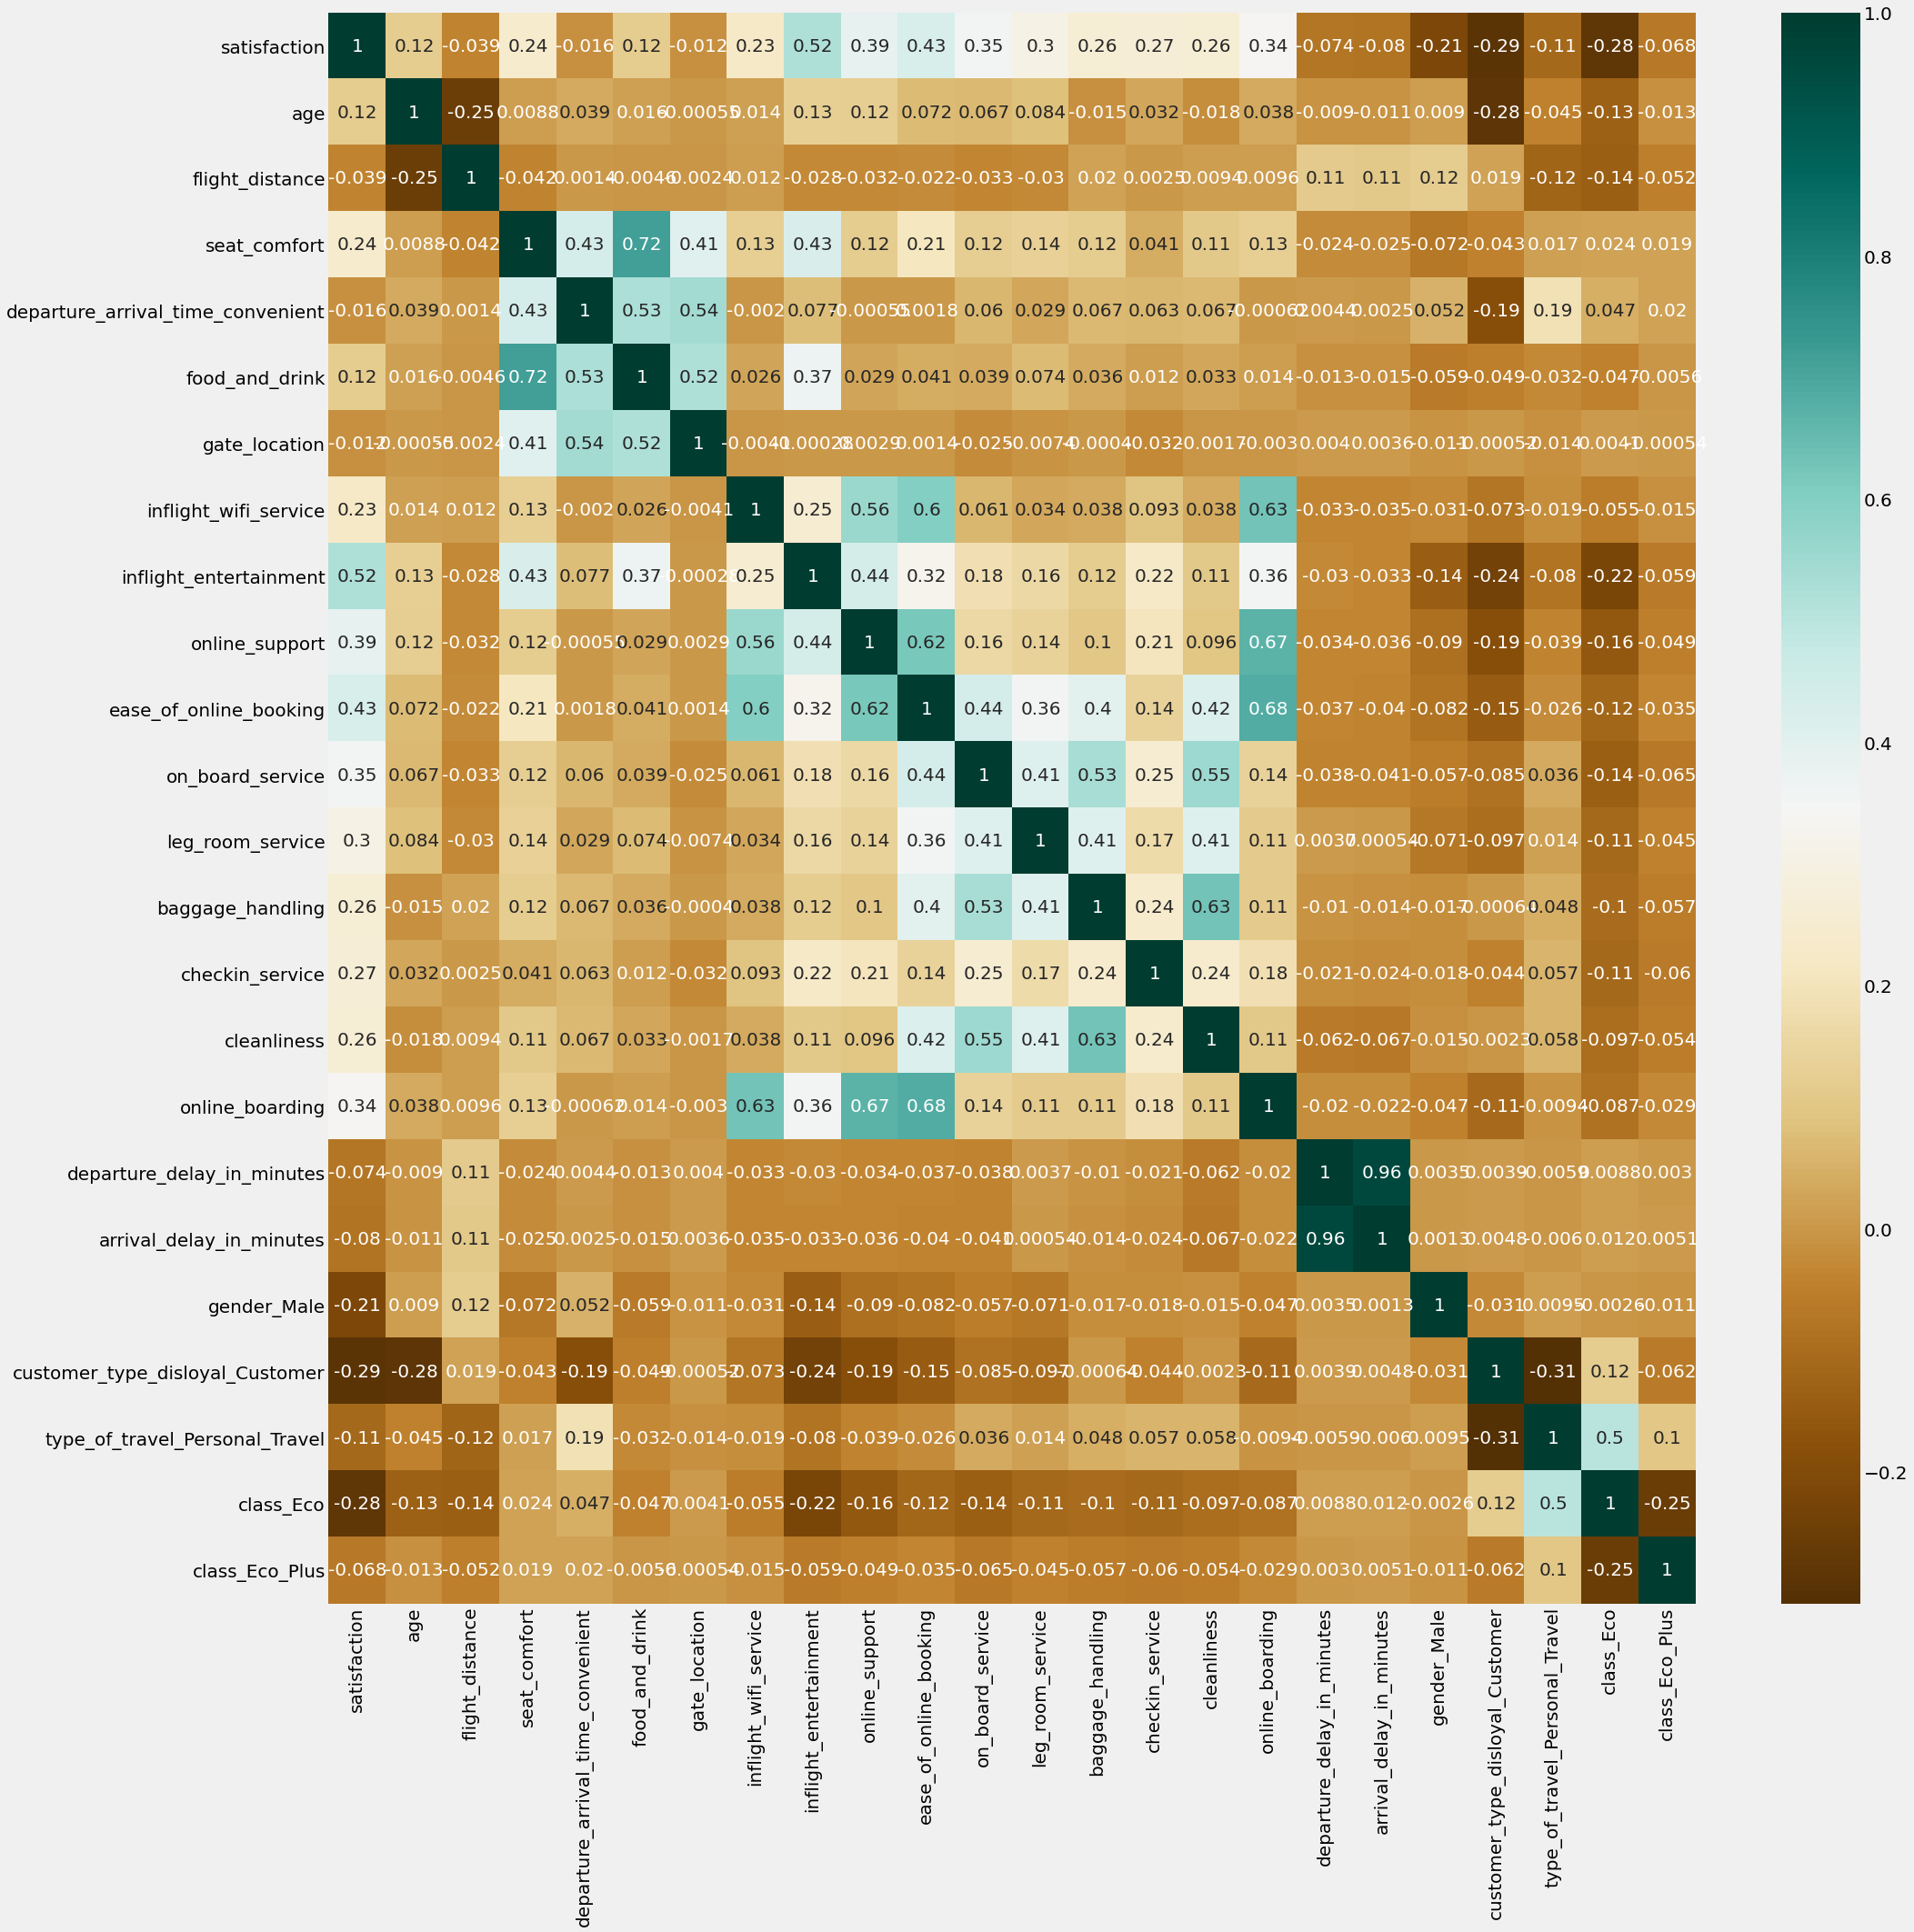
Figure 4: Correlation matrix
Figure 4 shows that inflight_entertainment, online_support, ease_of_online_booking have higher correlation with satisfaction compared to other attributes. Other interesting correlation I noticed was that there was very high correlation (correlation = 0.96) between departure_delay_in_minutes and arrival_delay in_minutes. Despite of replacing the missing value with the mean of the arrival_delay_in_minutes, I just excluded the “arrival_delay_in_minutes” column entirely to avoid imperfect multicollinearity.
Method of Data Analysis
The dependent variable (satisfaction) is binary, and it is either true (1) or false (0). Because the dependent variable is binary, it would be more appropriate if I use a non-linear model instead of a linear model (because a linear probability model may have a predicted probabilities below 0 or exceed 1 given some value of a regressor). Therefore, I have two options (probit or logit regression) to examine the causal effect. Since probit and logit regressions usually give similar results, I may just use probit here.
I included satisfaction as the dependent variable. As for independent variables, I picked inflight_entertainment and ease_of_online_booking as they are highly correlated to the passenger’s satisfaction, and which may influence customers’ satisfaction as well.
The service profit chain (Heskett et al., 1994) illustrated that there was a relationship between customer satisfaction and customer loyalty, however, the article did not show whether causality exists. Therefore, I would also like to examine the causal effect between satisfaction and customer type (disloyal customer, loyal customer).
Because the other 19 variables are also important in determining customer satisfaction, to eliminate omitted variables bias, I would also take the other 19 variables as control variables.
What are you testing by using this model/method?
First, I will start with a simple probit regression with inflight entertainment as the only independent variable. Then I will add other independent variables one by one to the model to see whether there are omitted variable bias. Next, I want to examine interactions between variables. Finally, I would also like to use Wald-statistic for hypothesis concerning several coefficients.
To avoid inconsistency of OLS standard errors and make sure the hypothesis tests are reliable, I use heteroskedasticity-robust standard errors (cov_type=’HC1’) when constructing the models.
What kind of data transformation needed?
The dependent variable is shown in text (satisfied, dissatisfied), therefore, I mapped them to 1: satisfied, 0: dissatisfied. I created dummy variables for the other categorical variables. To avoid perfect multicollinearity, I only get 1 dummy out of 2 categorical levels by removing the first level.
Results
|
Dependent variable:
satisfaction, binary, 129,880 observations |
||||||
|
Regressor |
(0) |
(1) |
(2) |
(3) |
(4) |
(5) |
|
customer type = disloyal
Customer (Binary, CT) |
|
-1.3342 (0.014) |
-1.1619 (0.014) |
-1.1182 (0.015) |
-1.2570 (0.044) |
-0.3066 (0.052) |
|
inflight entertainment (IE) |
|
|
0.3666 (0.005) |
0.3767 (0.005) |
0.3679 (0.005) |
0.3444 (0.005) |
|
ease of online booking (EOB) |
|
|
|
0.1272 (0.007) |
0.1269 (0.007) |
0.1887 (0.007) |
|
CT x IE |
|
|
|
|
0.0456 (0.013) |
0.0549 (0.012) |
|
CT x EOB |
|
|
|
|
|
-0.3016 (0.010) |
|
|
|
|
|
|
|
|
|
The other 19 control
variables |
Y |
Y |
Y |
Y |
Y |
Y |
|
Intercept |
-2.7010 (0.032) |
-2.1724 (0.034) |
-2.7572 (0.036) |
-2.6470 (0.037) |
-2.6224 (0.037) |
-2.7536 (0.038) |
|
Wald-Statistics and p-Values
Testing Exclusion of Groups of Variables |
||||||
|
interactions and CT |
|
|
|
|
|
6953.72 (0.000) |
|
interactions only |
|
|
|
|
|
1015.59 (0.000) |
|
|
|
|
|
|
|
|
|
psudo R-square |
0.3341 |
0.3946 |
0.4340 |
0.4361 |
0.4363 |
0.4425 |
|
difference in predicted
probability of satisfaction, loyal vs disloyal (%) |
|
48.4% |
43.5% |
42.1% |
46.2% |
11.7% |
Standard errors are in parenthesis under the
coefficients. p-values are given in parentheses under the F-statistics. The
difference in predicted probabilities of satisfaction is calculated with the
sample means of the regressors (other than customer_type_disloyal_Customer).
For joint hypotheses testing, the p-value are in parentheses.
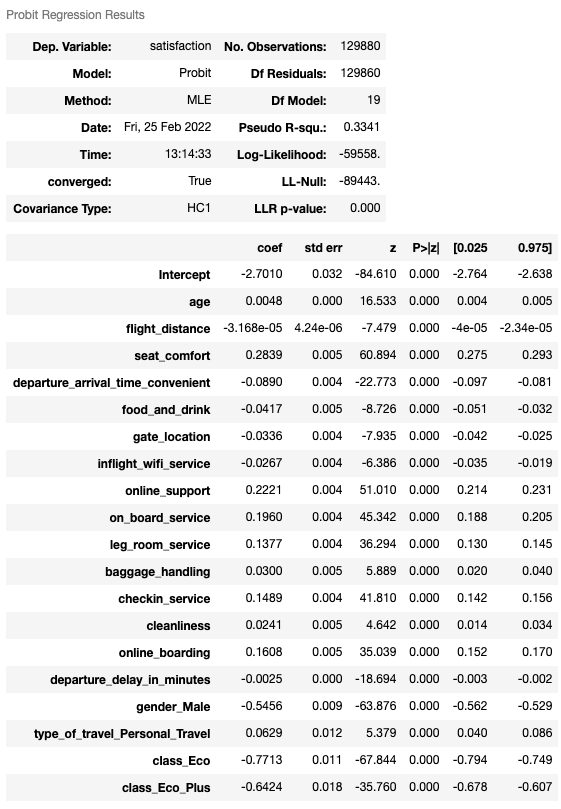
Model (0): satisfaction ~ The other 19 control variables
-
The p-values of all 19 variables are individually statistically significant.
-
The pseudo R-square here is 0.3341.
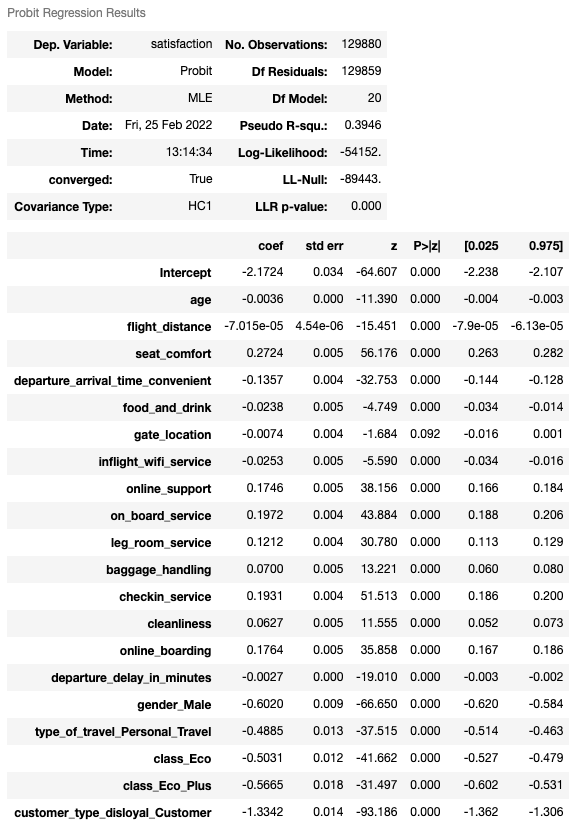
Model (1): satisfaction ~ customer_type_disloyal_Customer + The other 19 control variables
-
After adding customer_type_disloyal_Customer (a binary variable, 1 indicates disloyal customer, 0 indicates loyal customer), the coefficient of customer_type_disloyal_Customer is -1.3342, the negative sign means that the z-value of a disloyal custom is less than a loyal customer (holding constant other regressors). The t-statistic is -93.186 which is very significant.
-
The p-value of gate_location became 0.092 from 0.000 after adding customer_type_disloyal_Customer, so we cannot reject at the 5% significance level that the hypothesis that the coefficient of gate_location is 0. Model (1) provides no evidence that gate_location will have big influence in customer satisfaction.
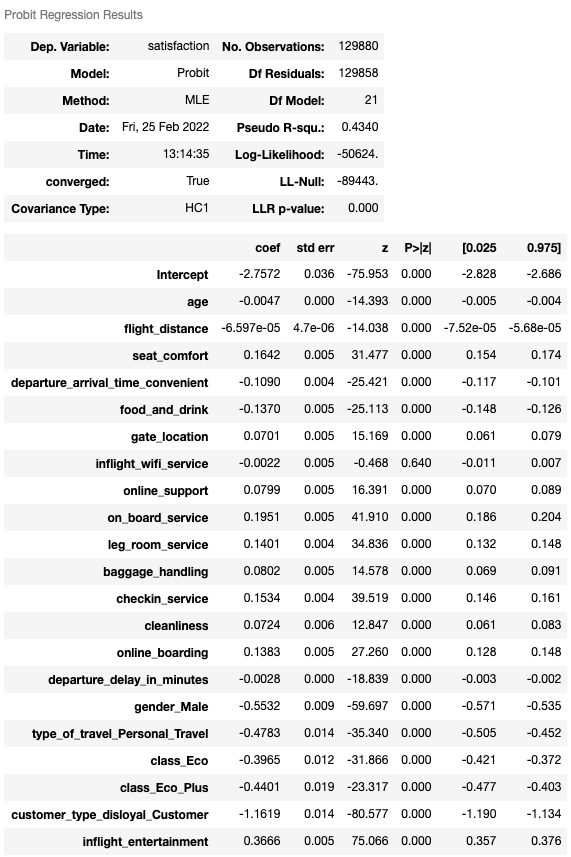
Model (2): satisfaction ~ inflight_entertainment + customer_type_disloyal_Customer + The other 19 control variables
-
The coefficient of inflight_entertainment is the difference in the z-value associated with a unit difference in inflight_entertainment. That is, the coefficient of inflight_entertainment is 0.3666, and if inflight_entertainment increase by 1 (holding other regressors constant), the probability of satisfaction increases by the difference of the probabilities in the tail of the standard normal distribution to the left of z and z + 0.3666, and the probability difference depends on z. (Note: the values of inflight_entertainment are 0, 1, 2, 3, 4, 5. The higher the number, the more satisfied of the customer to the service.)
-
The coefficient of inflight_entertainment here is a positive value, which means that higher rating in inflight_entertainment leads to have a higher probability in satisfaction. The t-statistic of inflight_entertainment is 75.066 which is also very statistically significant.
-
After adding the inflight_entertainment, the coefficient of customer_type_disloyal_Customer increased from -1.3342 to -1.1619, which means that the effect of whether the customer is loyal or not has less effect to the customer satisfaction compared to model (1) if we also consider inflight_entertainment, which indicates that model (1) had omitted variable bias. However, customer_type_disloyal_Customer is still statistically significant.
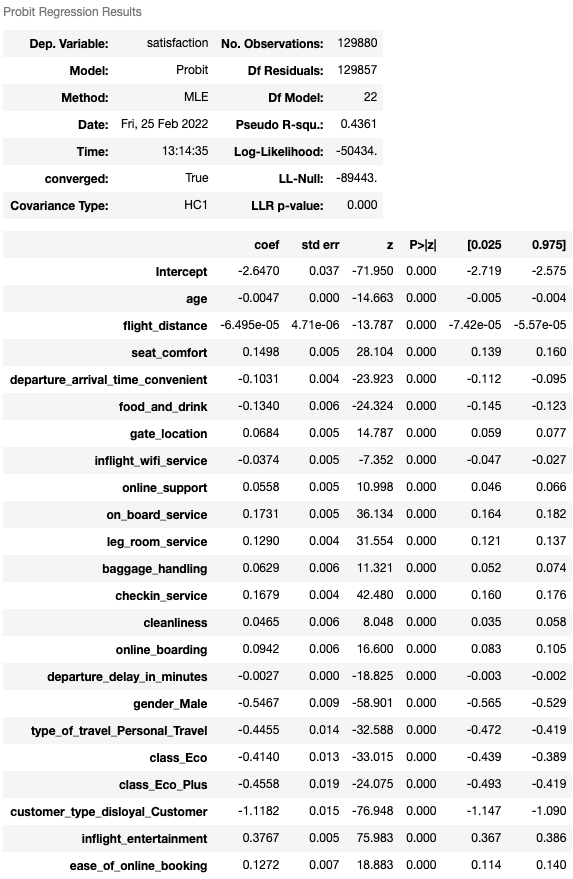
Model (3): satisfaction ~ ease_of_online_booking + inflight_entertainment + customer_type_disloyal_Customer + The other 19 control variables
-
After adding ease_of_online booking, the coefficients of regressors in model (3) did not have much difference from model (2). Though ease_of_online_booking is still statistically significant at 5% confidence level, it is less significant compared to customer_type_disloyal_Customer and inflight_entertainment. We can see that the t-statistic of ease_of_online_booking is 18.883, which is less than -76.948 of customer_type_disloyal_Customer and 75.983 of inflight_entertainment. -The estimated difference in satisfaction probabilities did not change much from model (2) to model (3) as well.
-
The psudo R-square is 0.4361 which has only little change from 0.4340 of model (2).
Model (4): satisfaction ~ disloyalIE + ease_of_online_booking + inflight_entertainment + customer_type_disloyal_Customer + The other 19 control variables
This examines whether there is interaction of customer loyalty and inflight entertainment. Do disloyal and loyal customers have different reaction in satisfaction to different rating in inflight entertainment?
-
After adding the interaction term, disloyalIE, the coefficients of regressors did not have big changes from model (3).
-
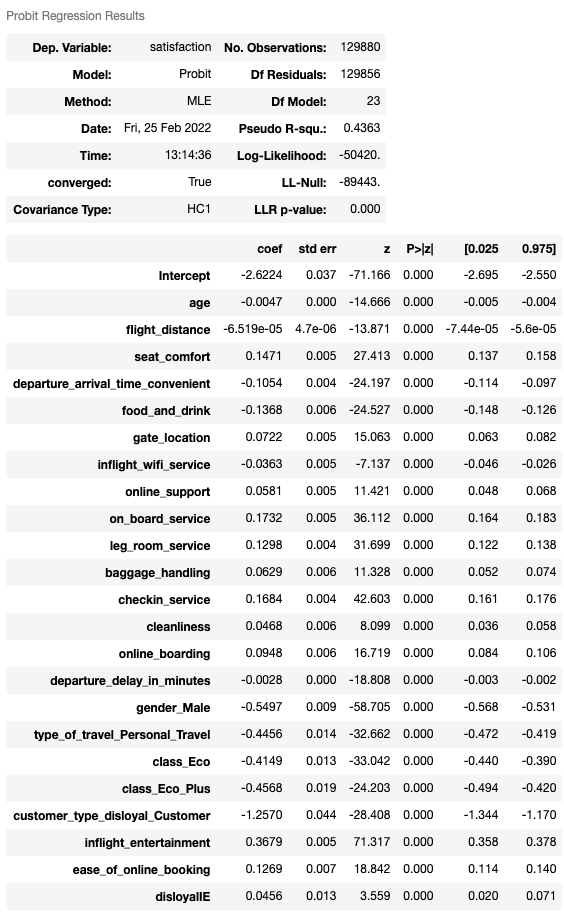
The coefficient of disloyalIE is 0.0456, which indicates that for a disloyal customer, the z-value increases 0.0456 more than that of a loyal customer. In other words, disloyal customers tend to give you more positive feedback in terms of satisfaction than loyal customers when the rating of inflight_entertainment is increased.
Model (5): satisfaction ~ disloyalEOB + disloyalIE + ease_of_online_booking + inflight_entertainment + customer_type_disloyal_Customer + The other 19 control variables
-
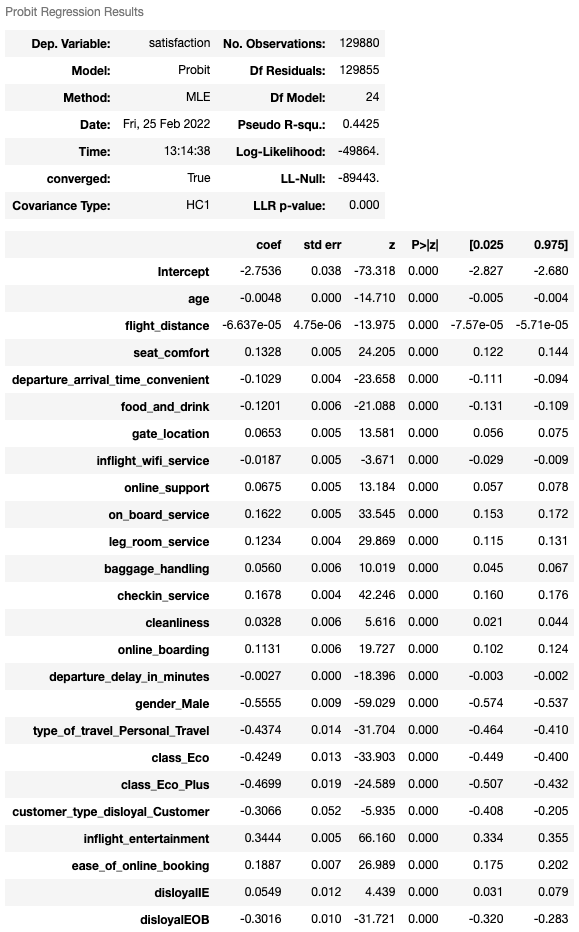
After adding the interaction term, disloyalEOB, customer_type_disloyal_Customer had a big change from -1.2570 in model (4) to -0.3066 while the coefficients of other regressors did not change much. Furthermore, we can see that the t-statistic of disloyalEOB is quite significant, which indicates that the previous model suffered an omitted variable bias.
-
After adding disloyalEOB, the difference in predicted probability of satisfaction between loyal and disloyal customers dropped significantly from 46.2% in model (4) to 11.7%, this could be caused by the big change in the coefficient of customer_type_disloyal_Customer.
-
The coefficient of disloyalEOB is -0.3016, this is not easy to interpret in a probit model, but I can try to say that the z-value of a disloyal customer increase 0.3016 less than loyal customer in each increment of ease_on_online_booking. In other words, loyal customers tend to give you more positive feedback in terms of satisfaction than disloyal customers when you increase the ease_of_online_booking.
-
I conducted wald test to test the joint significance of intersection terms and wald test on interaction terms and customer_type_disloyal_Customer. Both results are jointly statistically significant at the 5% level. The interaction terms are jointly statistically significant indicates that at least one of the interaction terms has significance to satisfaction.
Conclusion
From model (1) to (3), I conclude that there are causal effects between satisfaction and customer type, inflight entertainment, and ease of online booking.
From the significant differences in predicted probability of satisfaction in model (1) to (5), I conclude that loyal customers are easier to be satisfied by the services than disloyal customers. However, this may need more hypotheses testing to reinforce this conclusion.
References
- Khanal, B. Airlines customer satisfaction. Kaggle. Retrieved December 5, 2021, from https://www.kaggle.com/bimarshakhanal/airlines-customer-satisfaction.
- Heskett, J.L., Jones, T.O., Loveman, G.W., Sasser, W.E. Jr and Schlesinger, L.A. (1994), “Putting the service profit chain to work”, Harvard Business Review, March-April, pp. 105-11.
- Airlines Customer satisfaction. (n.d.). Kaggle. https://www.kaggle.com/sjleshrac/airlines-customer-satisfaction
